
Signals Converging
Issue #5 -- Dr. Jeff's Macro Chartbook

“The trend is your friend until the end when it bends.” -- Ed Seykota
I don’t usually feel urgency.
I’m a pattern guy. I watch. I wait. I observe. I’ve spent decades reading images for a living -- first as a radiologist, where a subtle shadow in the wrong place could forever change a patient’s life, and now as a macro fund manager, where a pattern repeating across multiple timeframes and multiple asset classes demands serious attention.
Right now, several charts are converging on the same message simultaneously. And the geopolitical backdrop suggests the window for clear thinking may be shorter than most people realize.
I want to be careful here, as always. I don’t predict. I observe. But when the dollar, Bitcoin, global liquidity, oil, and a 40-year chart of the NASDAQ priced in gold all start telling the same story at the same time, that is worth pausing to examine carefully.
This issue is my attempt to lay it all out, clearly and honestly, before things get louder.
Let’s start with the foundation of everything: the US dollar.
Chart 1 -- US Dollar Index (DXY): A Critical Level Reclaimed
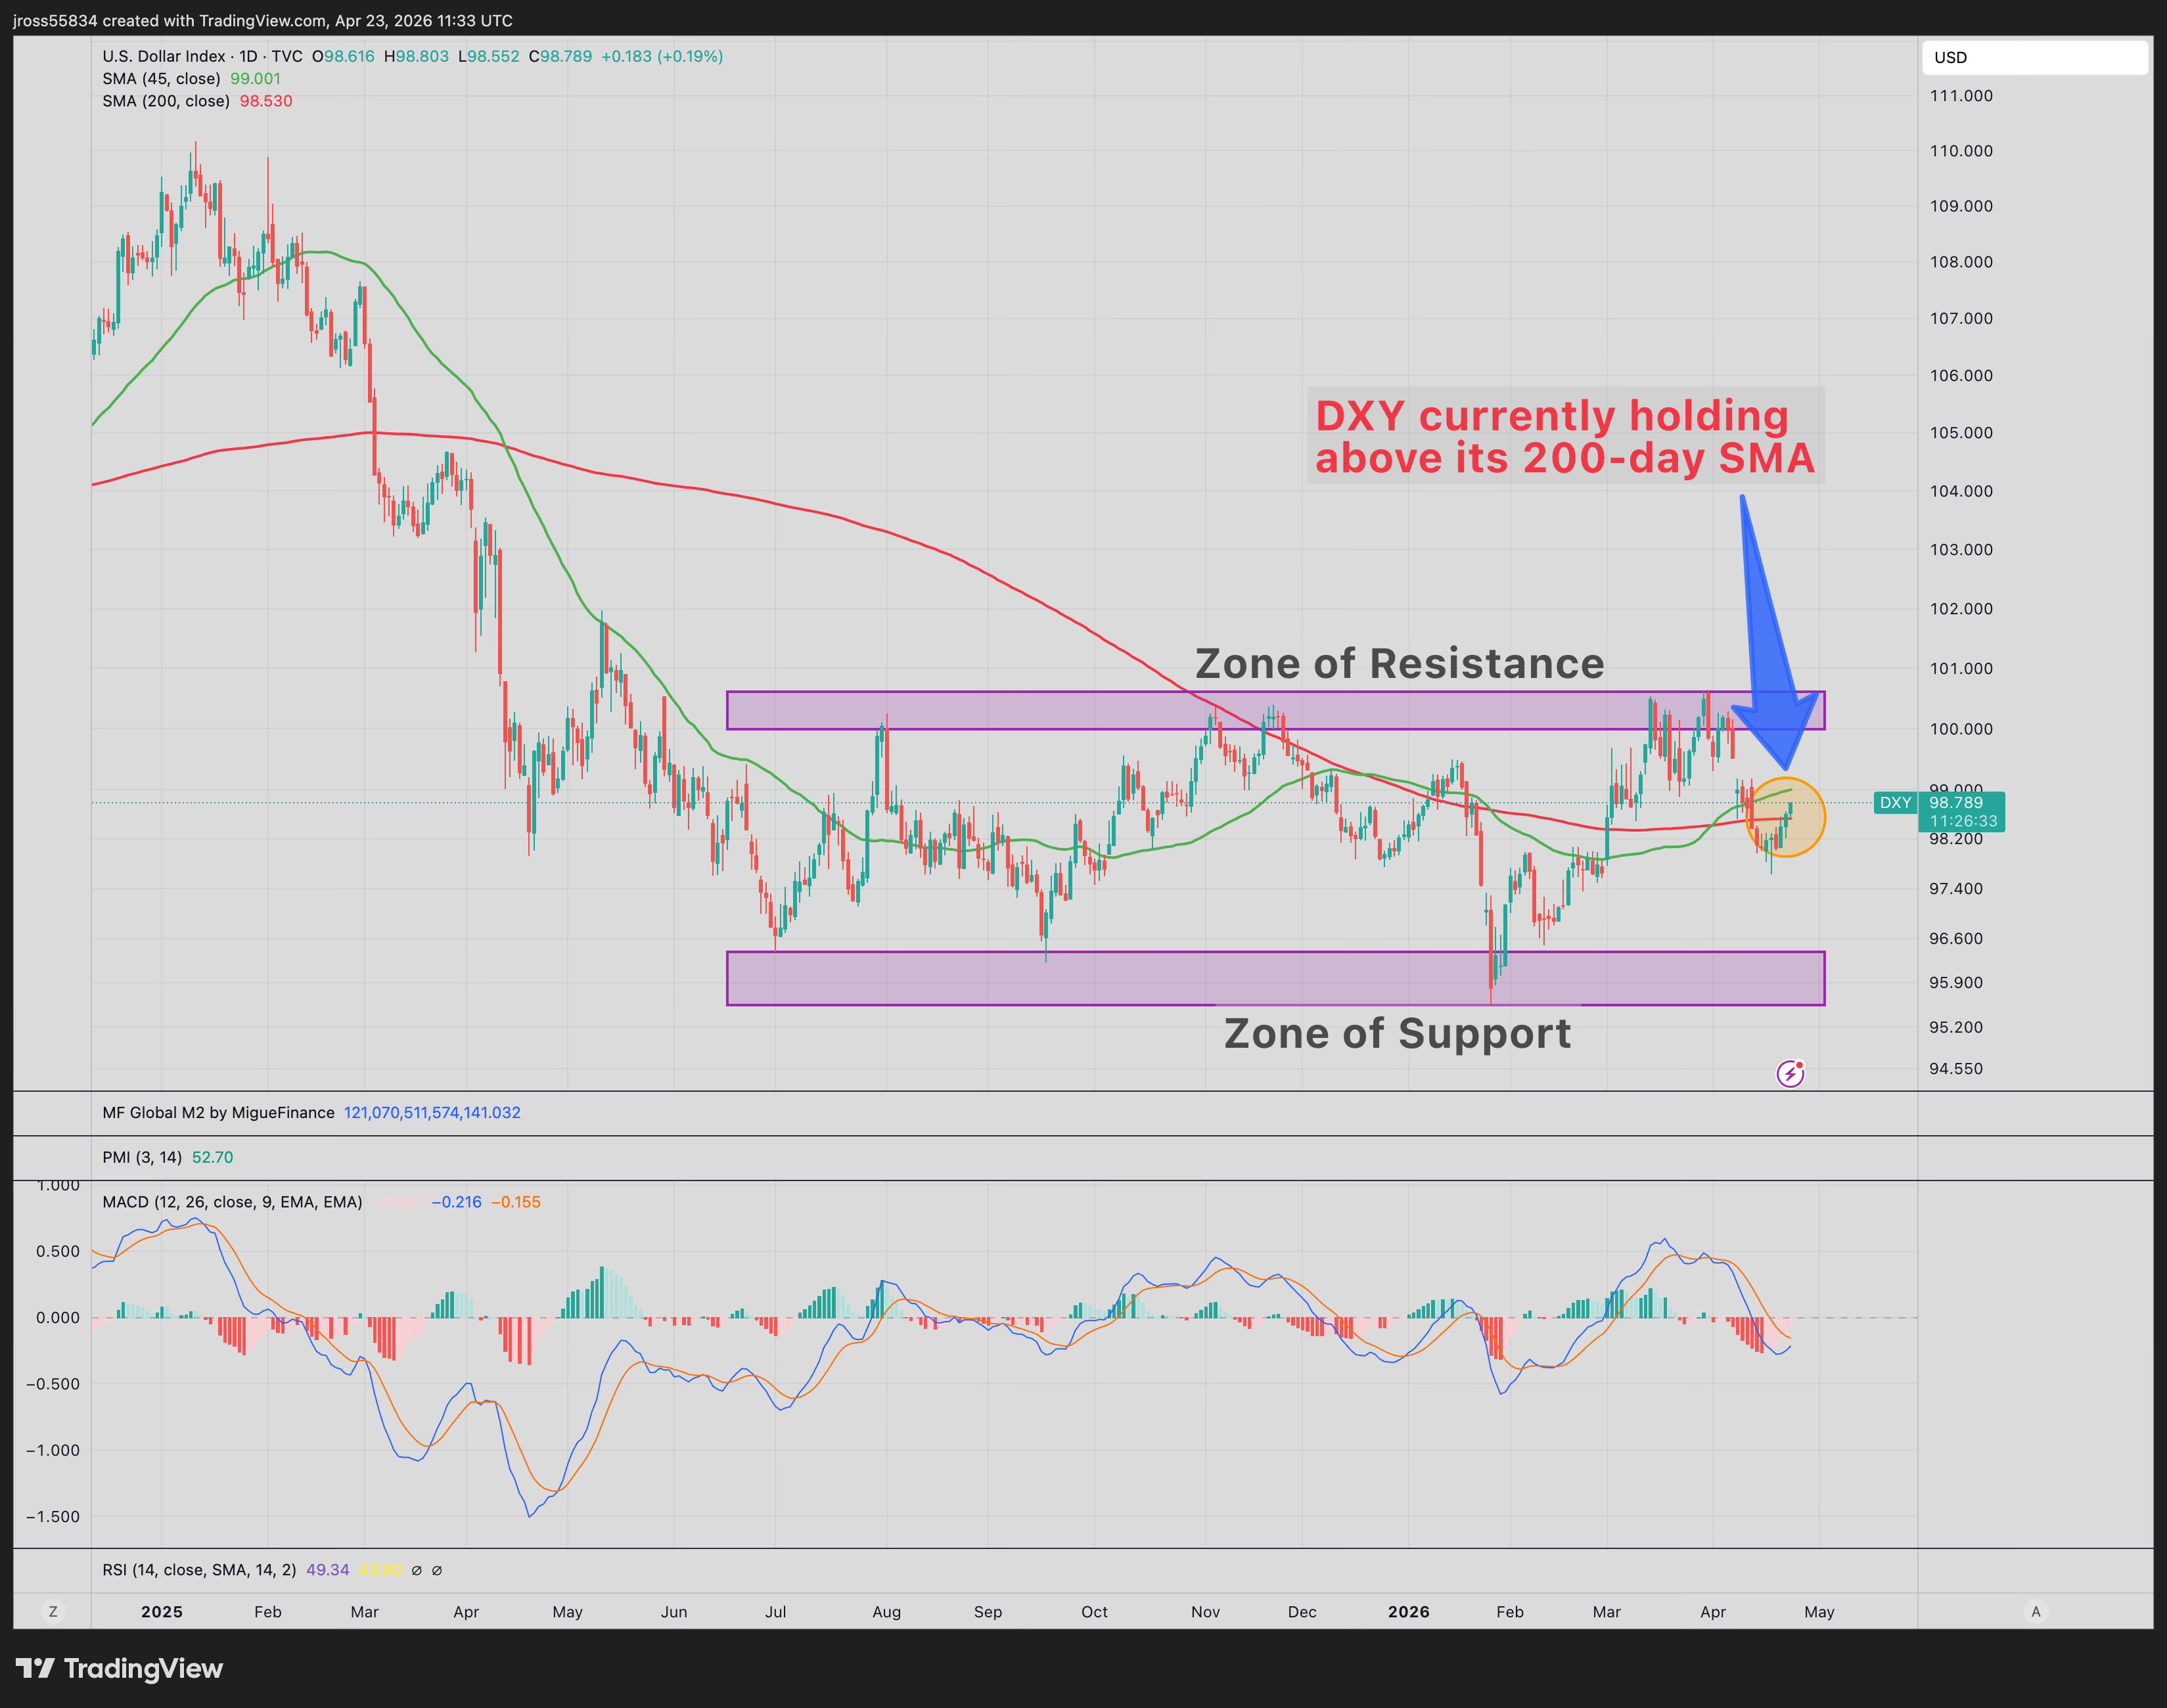
The US dollar has been chopping sideways for approximately one year, caught between a clear Zone of Support (roughly 95.50-96.50) and a Zone of Resistance (roughly 99.50-100.50). Neither bulls nor bears have been able to break the stalemate decisively.
Yesterday, something worth noting happened quietly: DXY closed above its 200-day simple moving average. And at the time of this writing, it is continuing to hold and strengthen.
That is a bullish short-term development. The 200-day SMA is one of the most widely-watched technical levels in global currency markets. Reclaiming it, even tentatively, shifts the near-term momentum picture.
The MACD remains negative, but is visibly trending upward from mildly oversold territory. RSI at 49.22 is neutral but strengthening. Neither indicator is shouting bullish conviction yet. But the direction of travel matters as much as the current reading, and both are gaining momentum.
Here is the geopolitical context that makes this chart particularly relevant right now:
If Middle East hostilities resume, and many serious observers believe that is a question of when rather than if, the dollar’s traditional role as the world’s safe-haven reserve currency would likely generate a meaningful bid in the short term. A flight-to-safety move toward the Zone of Resistance (99.50-100.50) from current levels would not be surprising in that scenario.
A rising dollar is a “wrecking ball” to most risk assets… at least in the short term, and while fear and uncertainty are pervasive.
The longer-term picture remains more complicated and nuanced. The structural forces working against the dollar, including fiscal deficits, military buildout, AI and energy infrastructure spending, and the broader global de-dollarization trend, have not changed. A short-term bounce toward resistance does not resolve a longer-term secular trend... which I think (must) include accelerating monetary debasement and yield curve control... but that’s another story for a future article!
In the near term, the dollar appears to be finding its footing. And that has implications for everything else in this issue, particularly Bitcoin, which we examine next.
Chart 2 -- Bitcoin: Bear Flags and a Critical Test
After decades of reading medical images, I developed an instinct for patterns that don’t quite look right. A subtle shadow in the wrong place. A shape that shouldn’t be there.
Right now, Bitcoin’s daily chart has that feeling.
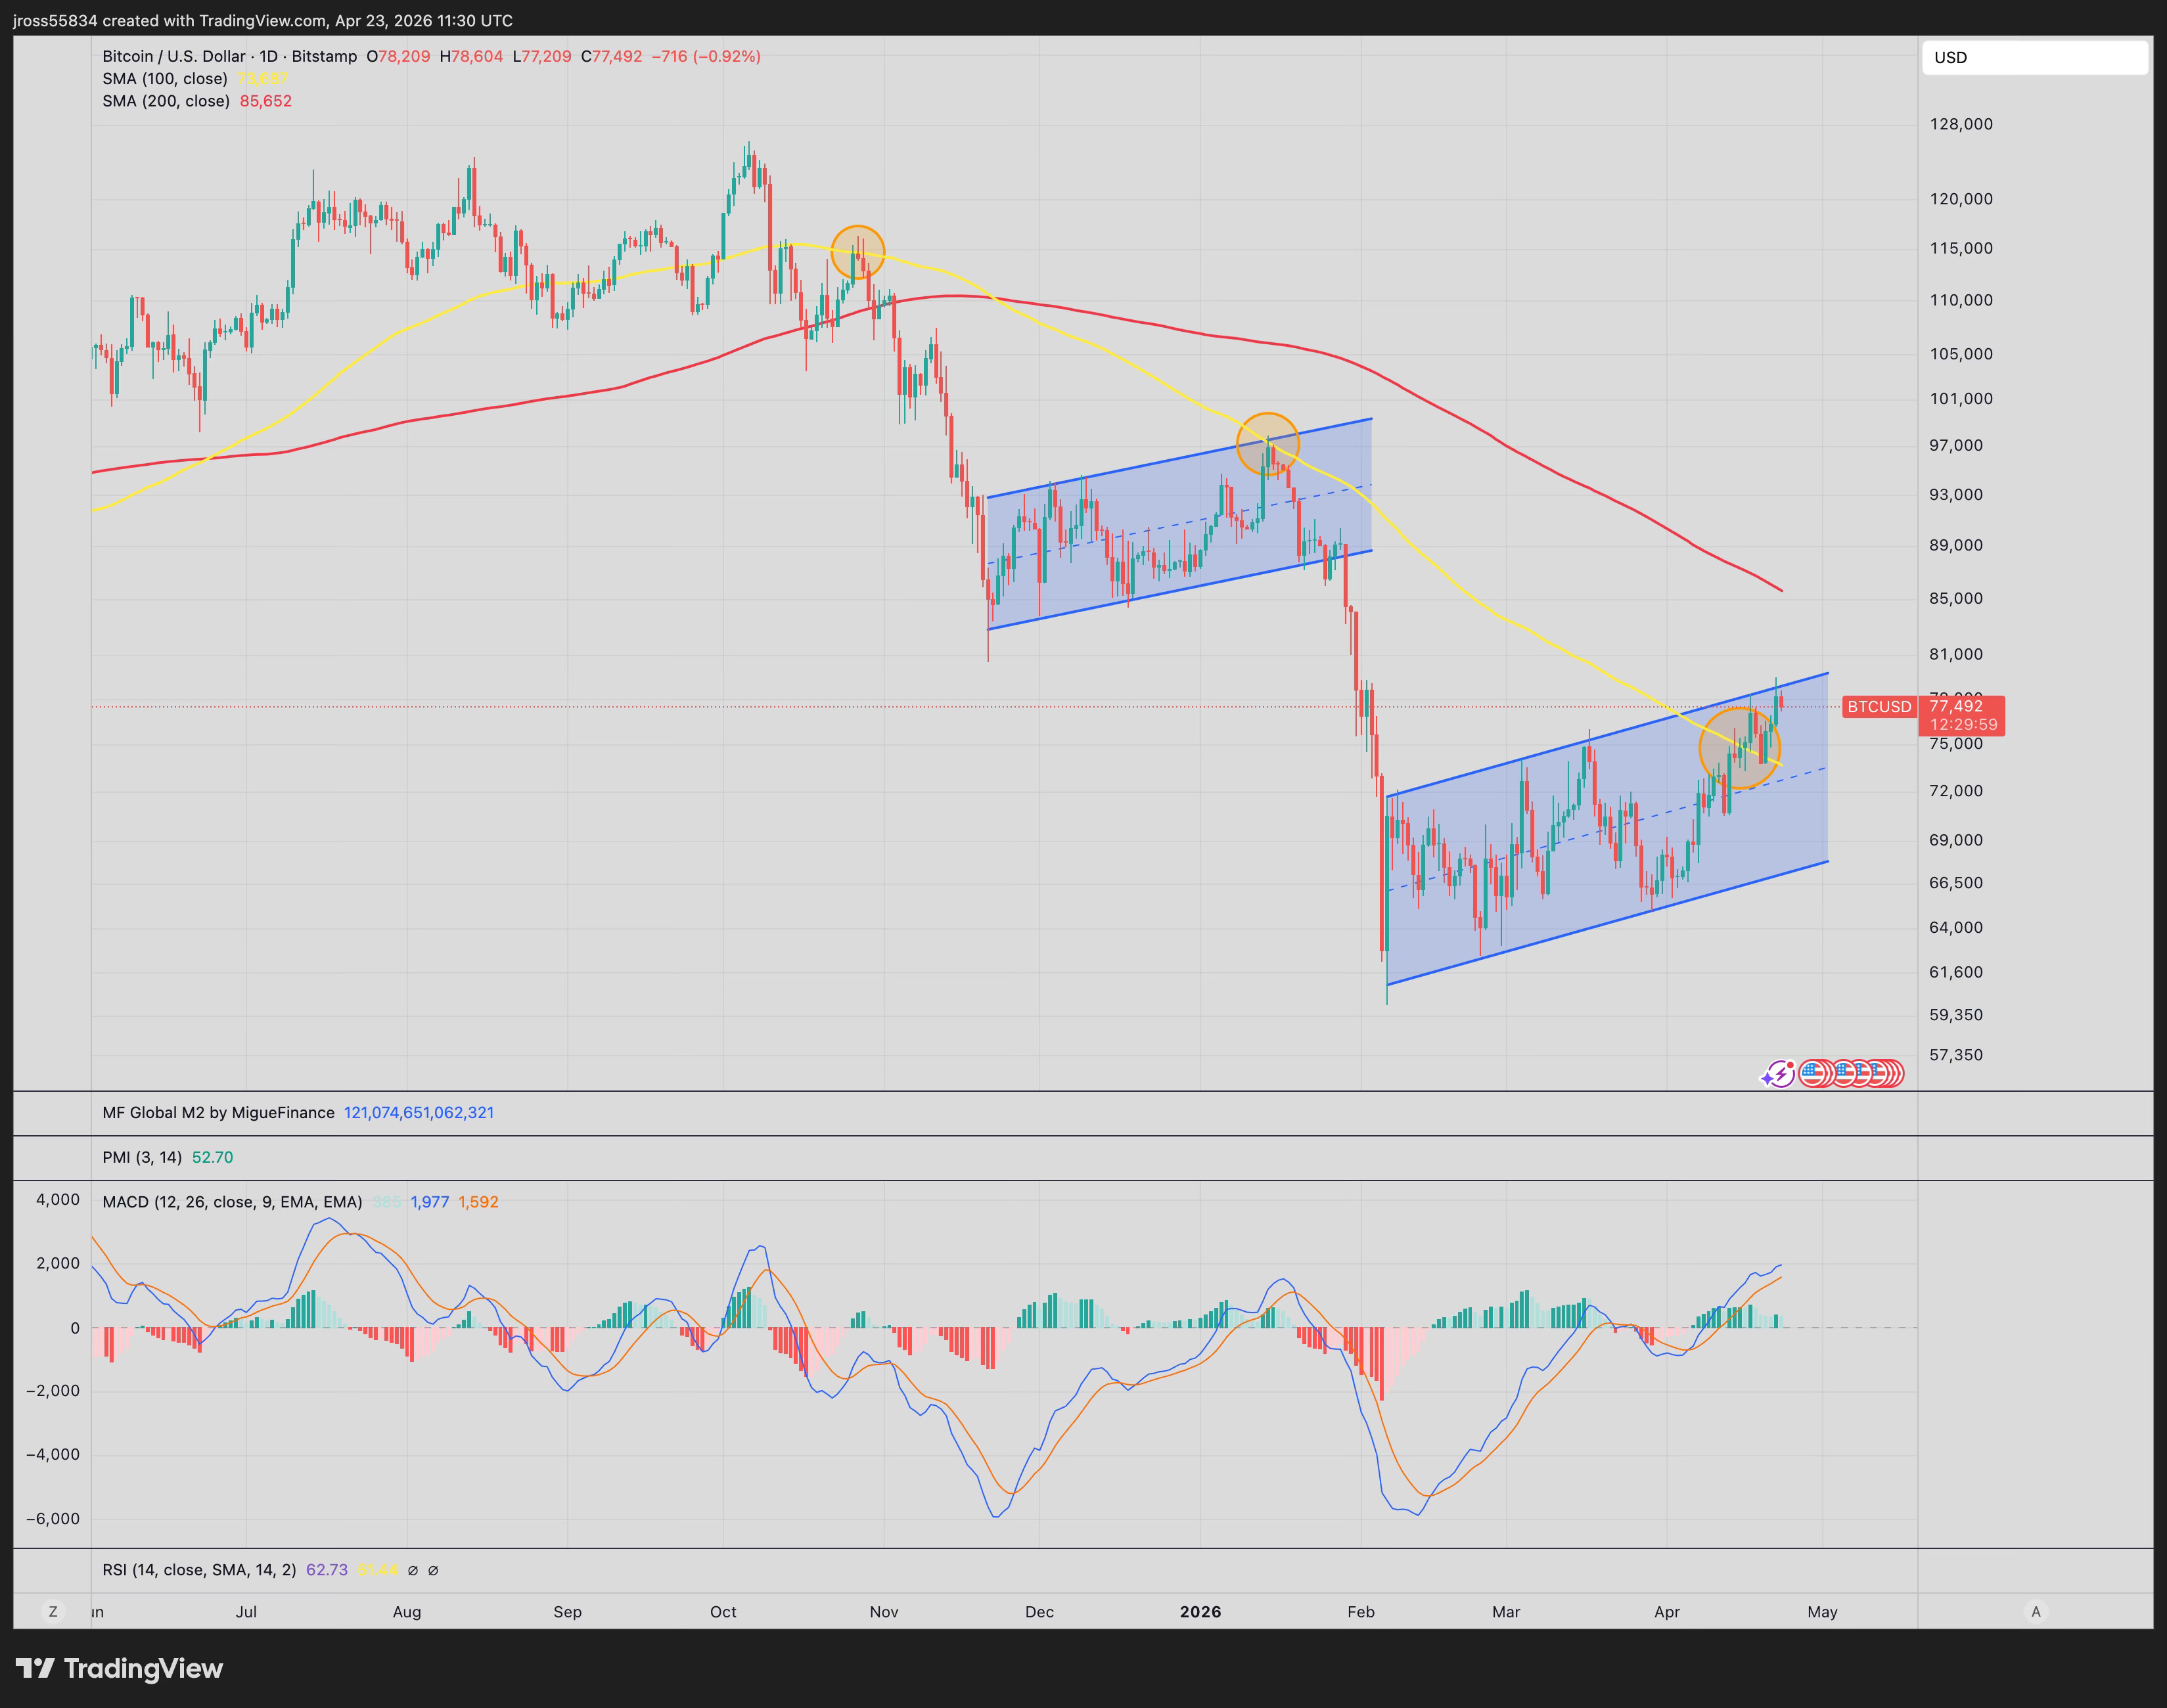
What you’re looking at are two textbook bear flags, or more precisely, bearish rising channels. For those unfamiliar, here is the plain English version:
A bear flag forms after a sharp, nearly vertical price decline. That’s the flagpole. Then price consolidates in a tight, upward-sloping channel. That’s the flag. It looks like a recovery. It feels like a recovery. People start talking about new highs.
Then, more often than not, price breaks down again, continuing in the direction of the original move.
Look at the first bear flag on this chart. Bitcoin rallied from roughly $83,000 back toward $96,000 in an orderly, gentle upward drift between December 2025 and February 2026. Then it broke down sharply, falling to below $60,000 in a matter of weeks.
The flagpole. The flag. The breakdown.
Now look at what is forming right now. A second rising channel, almost identical in structure to the first. The first two orange circles mark the precise moments where price kissed and was rejected by the 100-day SMA: October 2025 and January 2026.
There is one recent, mildly bullish development worth noting. Bitcoin broke above the 100-day SMA on April 16th and has held above it for several days. That is a meaningful medium term momentum signal. The MACD is still recovering and RSI at 62.73 has room to run.
However, here is the tension: price is simultaneously pressing against the upper boundary of the second bear flag channel. A breakout above that channel would change the technical picture meaningfully. A rejection from the upper boundary, particularly given the liquidity picture we are about to examine, would not.
Bear flag patterns historically resolve to the downside roughly 65-70% of the time in confirmed downtrends. They fail, meaning price breaks upward, roughly 30-35% of the time. These are meaningful probabilities, not certainties.
What I find more compelling than the pattern alone is what the next chart is telling us about the liquidity environment surrounding it.
The liquidity picture behind Bitcoin right now is one of the most important charts I’ve seen in months. Next, let me show you what liquidity guru Michael Howell’s data is suggesting -- and why it matters for everything else in this issue.
